Archives for January 2013

Market View 21st January

Our Longer Term and Shorter Term analysis continues to be positive and supportive for the equity market. But our Market Sentiment readings suggest that a high number of investors have turned from Bears to Bulls recently and if this continues it may become a problem. The market will often “overheat” when a majority of investors suddenly become actively bullish and we may be seeing the beginnings of this at the moment.

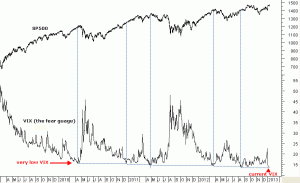
As an example we would cite an indicator often talked about in the media called the VIX. This is a volatility measure based on traded options data and is usually called the “fear gauge”. Knowing how to interpret this indicator is a key factor in assessing market sentiment. This is used as a “Contrarian Indicator”, such that when the Indicator (acting as a fear gauge) is very high, Stockmarkets will often have suffered significant losses. In contrast, when fear is low this often indicates that there is excessive optimism, usually following a stockmarket rally. When the VIX hits extreme readings this usually indicates the market has been over-stretched and a correction usually follows. Market rallies often follow periods when the fear of investing is extremely high, whilst sharp corrections can often follow periods when the fear of investing is very low, indicating that the public have become complacent. Currently the VIX is very low relative to readings over the last few years. On Friday it closed at its lowest level since 2007. This is a concern.

Another general market indicator that we find useful is to calculate the percentage of stocks within a market or index that are currently priced above their 50 day moving average (of price). So for instance, a reading of 68 for the UK Allshare would mean that 68% of the stocks within that index are trading above their 50day average price. If that overall percentage number is greater than 50 it usually indicates a healthy, positive market. However, if that number climbs above 80 it will often indicate a market that is overheating and ready for a correction. Currently that is where we are with the UK Allshare number at 87% and New York Nyse at 89%.

Mindful of this and looking at other readings we would say that the market is overbought, with equity investors, if not excessively enthusiastic, then certainly showing a high level of complacency. None of this fires off immediate signals for us but if history is a guide we should be a little more cautious right now than would otherwise be the case.
Market View 14th January

Both the Longer Term and Shorter Term analysis is supportive but tempered by the fact that the market is registering overbought technically and a number of our market sentiment measures are indicating, if not excessive enthusiasm, then certainly a high level of complacency. This doesn’t fire off immediate signals but makes us a little more cautious than would otherwise be the case.

Overbought? The percentage of stocks above their 50 day moving average within a market or index is a good market pulse indicator and is supportive when the number is greater than 50%. However, historically when the number gets above 80 the market has often stalled at least. Currently Nyse is reading 88% and UK (allshare) is at 87%. Also UK FTSE100 index has an overbought RSI (14) reading of 72, the highest since March 2010 (the RSI is the most popular indicator of price-rate-of-change used by market technicians).

Sentiment.
Consensus polls: We follow quite a few including the popular public investors poll by AAII which reported Bulls% higher last week at 46.4% (from 38.7%). That’s quite a jump and equal with w/e 21st December as the highest Bulls% since Feb 2012. Just to remind you, sentiment indicators are to be viewed from a Contrarian point of view, i.e. excessive bullishness is usually a warning (often an early warning).
Mutual Fund Flow: www.lipperusfundflows.com reported Equity Fund inflows of $18.3 billion in the week to 9th January. That is the largest (by far) single weekly inflow for years. I have to go back to September 2007 to find one higher. This is excessive bullishness and it lifted the inflow measured over four weeks to its highest level for years as well.
Volatility: The VIX, often called the fear guage closed on Friday at 13.36 which is the lowest since 2007. See the chart below.

As a further market timing tool we also look at the relative relationships between different asset classes. For years now when equities have been strong we have usually seen weak bonds and a weak dollar. Currently we would say that the US dollar index is in a weak position (good for equities) but US T-bonds are hinting they have found technical support following a two month decline and “may” start to rally. Should that happen it would usually imply weakness for equities. Of course if T-bonds break below that Support it would imply further weakness for bonds and therefore further strength for equities.

To summarise: both the Longer Term and Shorter Term analysis is supportive but we have reservations based on the above and to repeat last week’s comment, “Only if price confirms weakness by breaking support would we consider lowering our current beta. Otherwise, should the market correct a little we would view it as an opportunity”.

VIX fear guage is very low

VIX fear guage is very low


Market View 7th January 2013

Last week was volatile and saw a sharp rally putting the major equity indices back in a much stronger price location. Can this be sustained?

Positives:

1) Stronger price location. Equity indices are above levels previously considered chart Resistance.

2) Although the market rallied there was no obvious increase in bullish sentiment recorded by the majority of our market sentiment indicators.. For example, three out of four consensus polls we follow showed more Bears last week which, from a contrarian point of view (which is how these polls should be interpreted) is not bearish. Also Mutual Fund flows did not show any exceptional inflows last week indicating the average U.S. retail trader did not “jump on the rally” and again this is a contrarian indicator. One exception was the VIX (fear gauge) which fell sharply, closing the week at 13.83, very close to August’s extreme low which is a concern for the Bull case especially if it falls below that August low.

3) Our Longer Term Market Timing System based on market breadth is positive for all Major Market Charts.

Negatives:

1) There were large gaps up on the major index charts last week and historically these tend to be “filled”. In other words, the majority of the time following a large gap, the markets will fall back to where the gap started.

2) The market is overbought. A number of stock indices are registering very high readings on the technical oscillators based on price. e.g. FTSE 100 index had an RSI reading of 73 on Friday, its highest since March 2010. Also our day-to-day breadth measurements are very high; e.g. the percentage of Stocks on the London, New York and Nasdaq Stock Exchanges that are currently trading above their 50day moving average are now above 80% and again historically this is often close to the point where the markets stall at least.

3) We see the U.S Dollar as currently strong and for years now dollar strength has coincided with equity weakness, ie they have tended to move inversely. Also US T-Bonds, although they fell sharply in January, have reached what we consider to be important chart support and may rally. Once again they have tended to move inversely to equities over the last few years. We expect that within a few days either the dollar and bonds will fall back into a weaker position indicating a green light for equities or the reverse will happen and the dollar and bonds will advance with equities falling back.

Summary 

There is nothing within our analysis which shows any definite indications of a turn lower in the market but we see the possibility that the market might take a breather here. Only if price confirms weakness by breaking support would we consider lowering our current beta. Otherwise, should the market “correct” a little we would view it as an opportunity.